Finviz
AI-Powered Financial Stock Screener

I was asked to improve the user experience of Finviz
One of the largest stock screeners for investors & traders, featuring complex:
- Financial visualizations
- Portfolio tracking
- Crypto trading
Overview
The business model relies on selling Elite, that not only monitor public information, but also provides deep-dive analysis by experts, technical studies, export of data and customization features, such as advanced layout customization
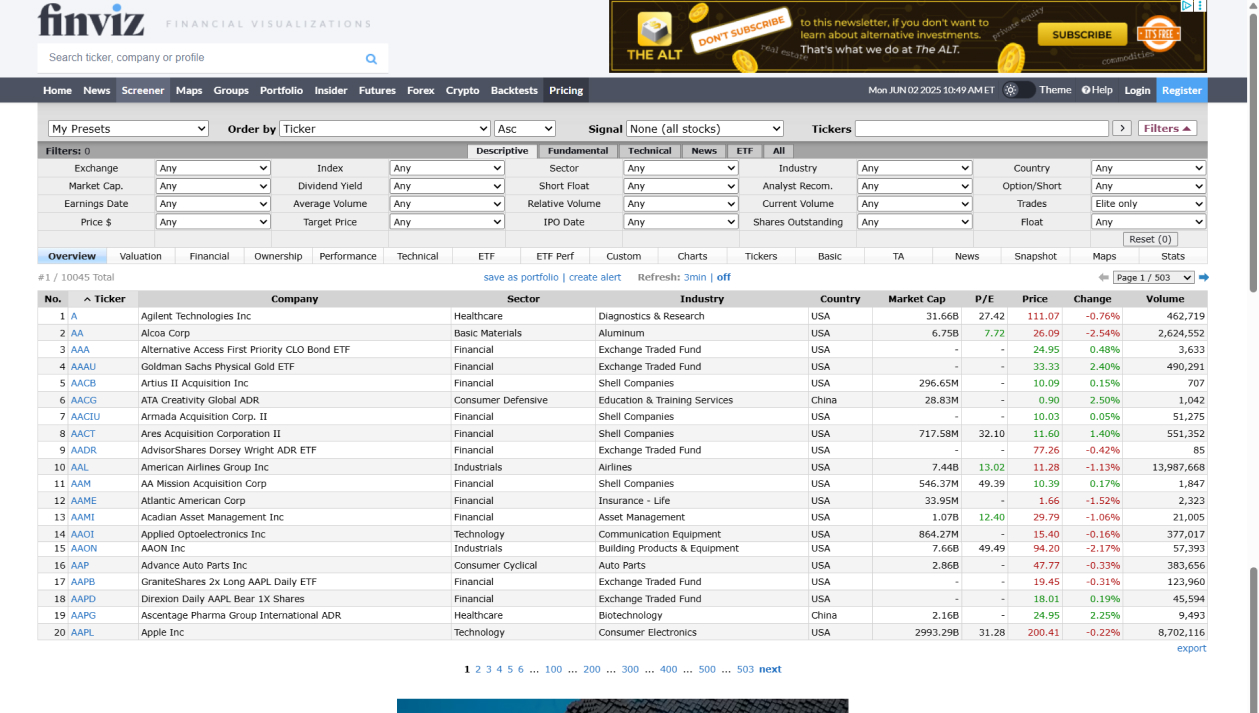
Original screen
Goal
The ultimate goal of the company is to sell more “Elite” tiers to their customers (half of the transition time from “free” to “Elite” from 42 days → 21 days).
Problem Statement
Interviews reveal frustration with slow data exploration; users prefer faster trend insights or expert-driven alerts and recommendations with likelihood scores.
Solution
The solution is to offer the Elite tier with the following funcionalities:
- Speed & automation (Real-time data, alerts, AI signals).
- More control & customization (Advanced filters, backtesting).
- More insights (Level 2 data, institutional trades, news feeds).
Introduce Elite version for new users in 21 day plan.
01 WEEK (day 1 – 7)
Onboarding & Awareness
The goal is to help users get familiar with the basics and the interface:
- Onboarding
- New features that user may find relevant (Elite features)
02 WEEK (day 8 – 14)
Conversion & Urgency
Boost engagement with advanced stock screening and subtle exposure to premium features.
- Real-time
- Alerts & Notifications
- By the end of the week, impactful features
03 WEEK (day 15 – 21)
Exploration & Reinforcement
Create urgency and smooth the upgrade path while highlighting premium value:
- Backtesting
- Premium Sneak Peek after the first 2 days of the week
- Time-Sensitive Offer for the last 2 days
The Process
RESEARCH
A user research study was conducted through interviews with real users, primarily aged 30 to 55, who typically possess the financial literacy and capital to engage in stock screening and investing. The majority of participants were male (estimated 90%).
Key Insights Gathered
New users find the interface very complex and difficult to use and understand.
Users love the ability to define and save presets and use it a lot.
Users complain about the speed of interaction on the site.
Users complain about how annoying and frustrating third-party advertising is.
Users often complain how difficult it is to find the right buttons and features on the site.
Users often complain how difficult it is to find the right buttons and features on the site.
Most frequently used features


Project’s constraints
There are some features that we know users have requested a lot in the past:
Better ways to save presets
Get actionable insights from the data
Use the right filters, faster
Custom alerts & notfications (only Elite)
Better ways to import their portfolios to the platform

Representative user tasks
Based on user interviews, I identified several representative tasks—commonly referred to as “top tasks”—that users frequently perform on FinViz. For example: “Set up an alert for a sharp drop in the S&P 500 (NYSE) to enable immediate action.” Then these tasks were then categorized into the following structured classification that can serve as the foundation for an AI-driven feature.
Action
Find
Identify
Group
Compare
Monitor
Track
Analyze
Set alerts
What
Alert for a sharp drop in S&P 500 (NYSE) value
Stocks with consistent dividend growth
Companies that have consistently beat en earnings estimates
Target allocation percentages
The P/E ratios of top 5 tech companies
Companies with consistently increasing profit margins
Insider transactions with market caps over $10 billion
The price performance versus the S&P 50
The debt/equity ratios of major airlines pre- and post-COVID
The EPS growth for emerging market stocks
Small-cap stocks with a dividend yield above 3% and compare their historical yields.
Stocks with a dividend yield above 3%
Industry
In the utilities sector.
In the consumer staples sector
Healthcare companies
In the oil and gas industry.
When
In the past 5 years
The 1-year and 5-year performance
Next 5 years
The past 6 months
The past 10 years in the utilities sector
Over the past 5 years
Over the past 3 years
IDEATION
Based on user insights, identified three key pain points that served as the foundation for improvement strategies.
My proposal as it follows with the main ideas.
Onboarding


Tootltip over features, specially over disabled Elite features

Filters
Filters can be removed, moved, or added. This way the user can build their own filters and save presets.
Group filters into relevant buckets.


Tags
The user can select the rows and ask to “tag positions”, “compare them for the last 5 years” or “show outliers”.

3º Pain point: Users want to understand trends faster, or ideally receive notifications and actionable recommendations from experts (with probability/likelihood scores) instead.
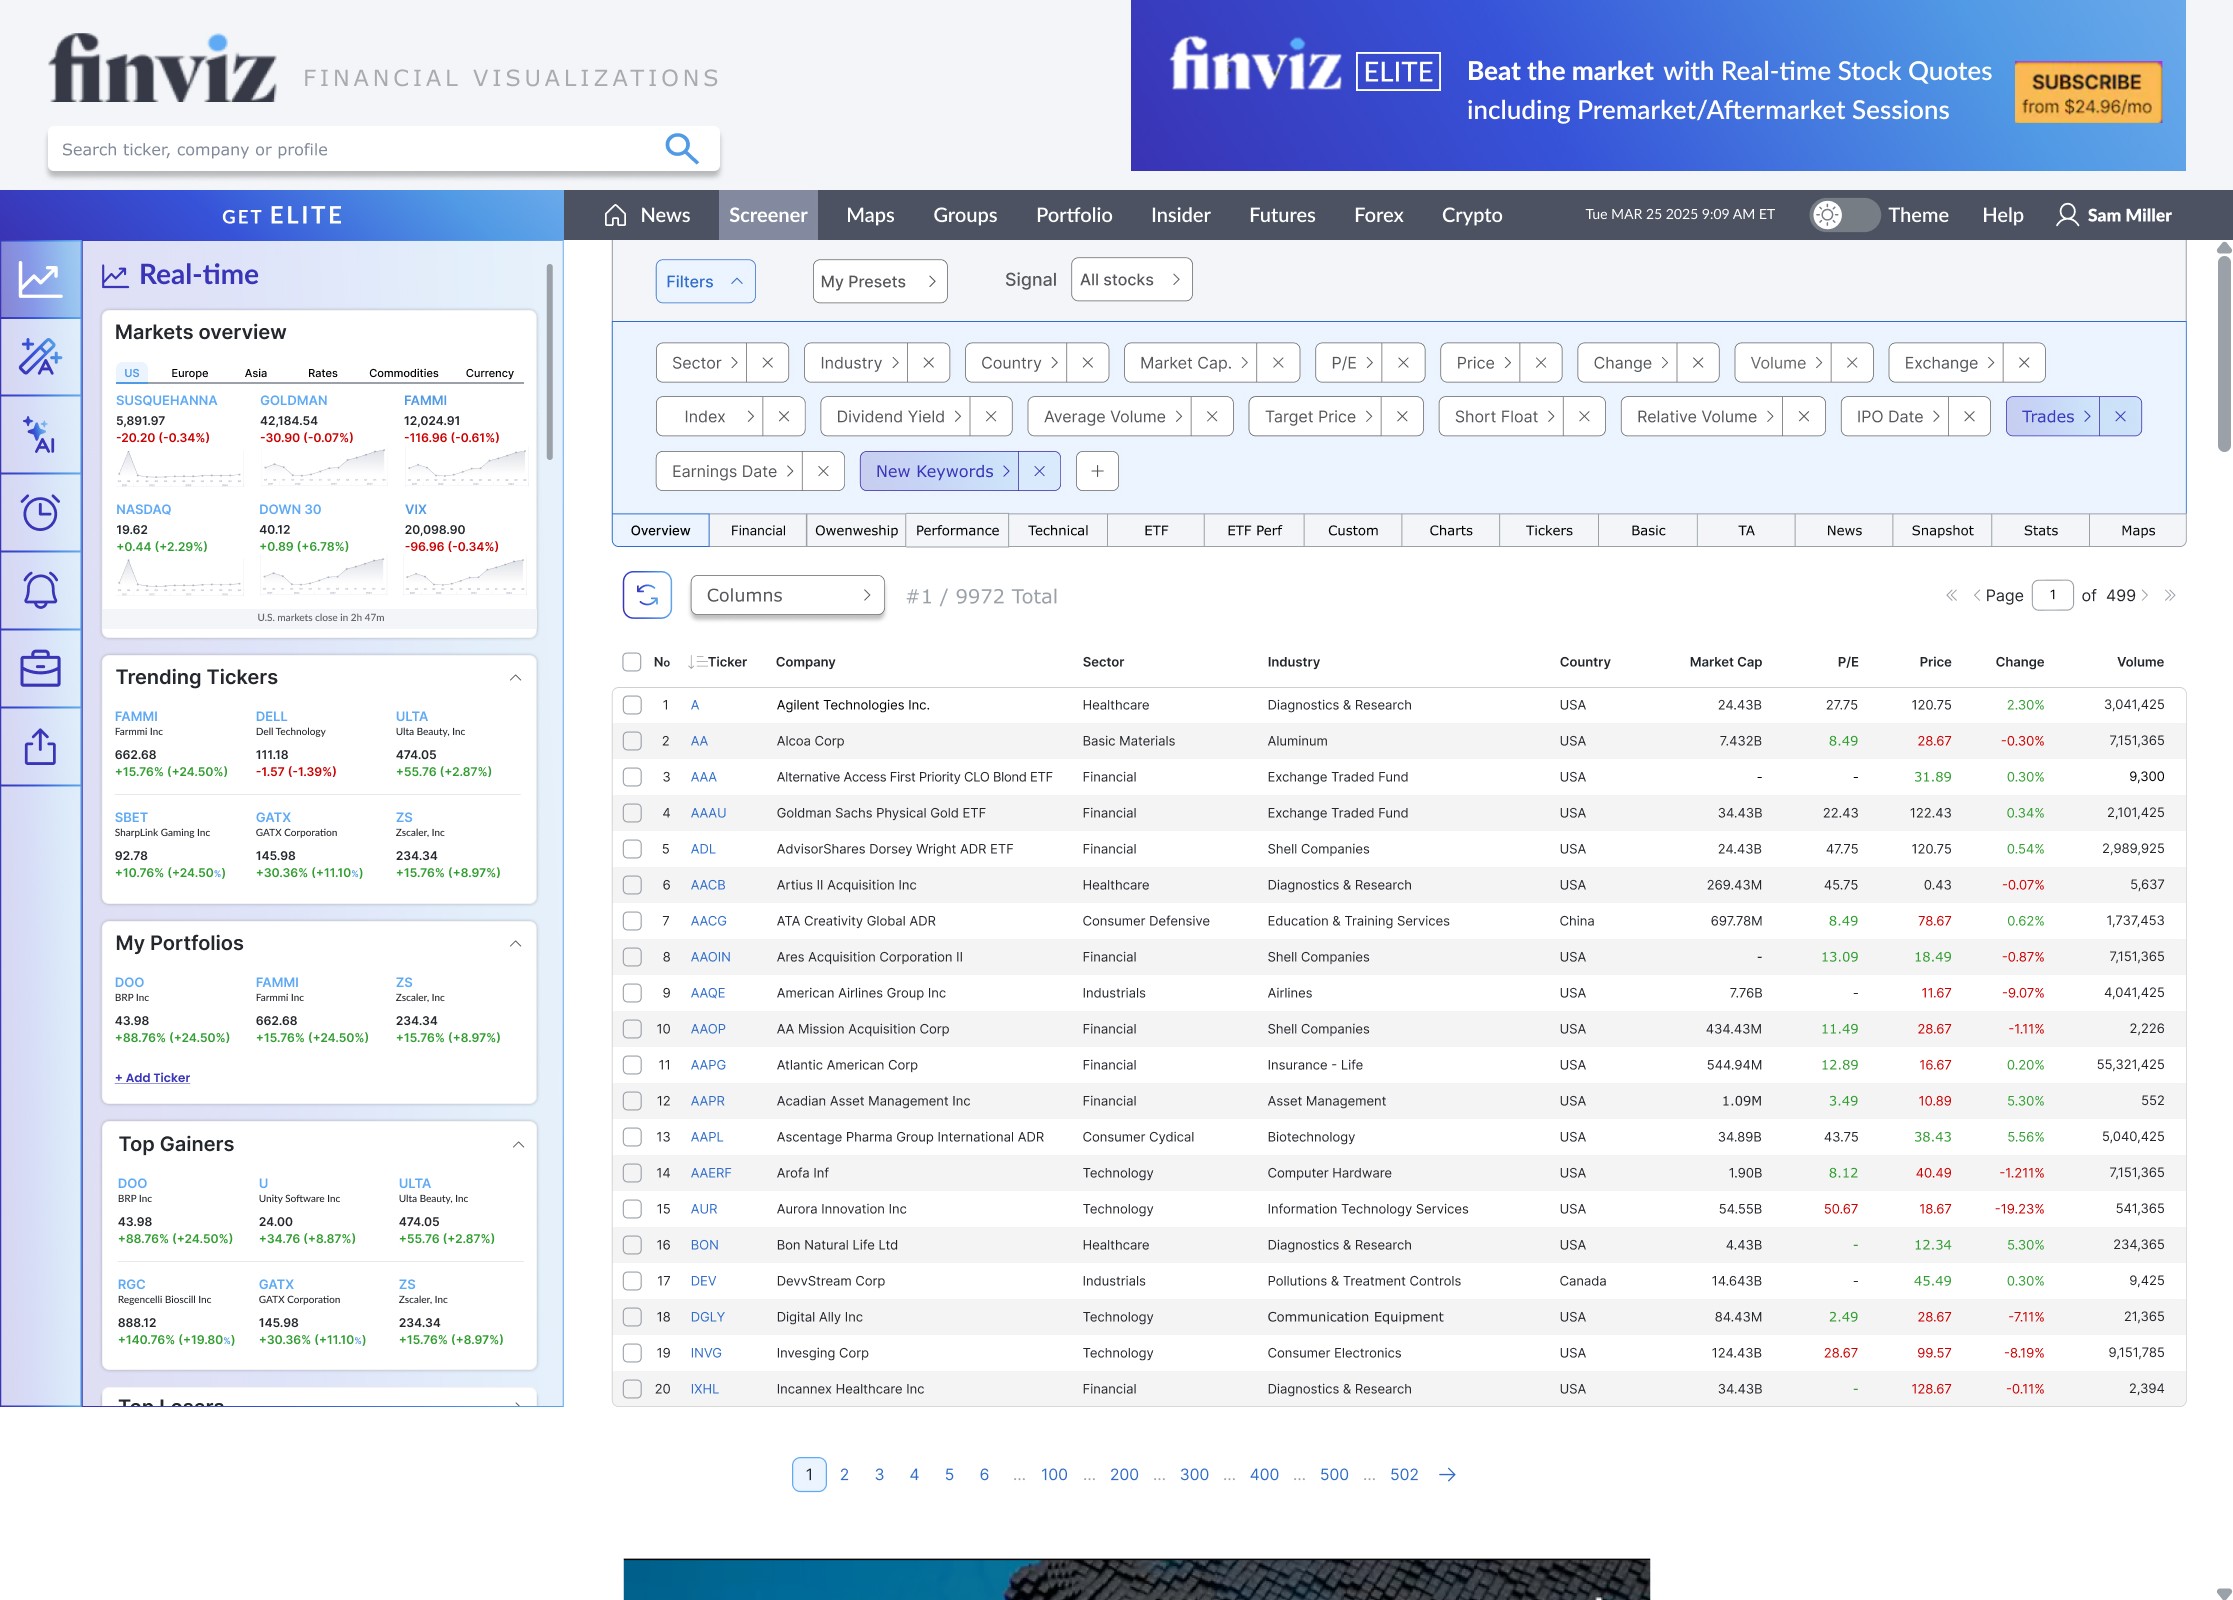
Real-time
Real-time updates are delayed 3 mint for the free version. I decided to highlight it and make it obvious that it’s a Elite feature.


I decided to include a real-time summary with several highlights so the user can have quick idea of how things are going: markets overview; trending tickers; top losers; top gainers; how the user’s portfolios are doing etc.
All of the topics covered in real-time are shown on this image. Users can adjust the view by closing, opening, and dragging items. On this image “top losers” has been moved from the bottom to the top.


Automations
I decided to include an option to automate common actions with the help of AI, so the user can save time on frequent tasks. Common actions like tagging positions, making comparisons, configuring alerts…
As a result, the user can automate frequent actions associated with representative tasks such as “When three stocks are selected, display insights about them.”

The user may see which tasks are active (left) and which are not (right) at the “Automation Management” screen.
In addition to editing the task’s content, the user can rename or remove all of the tasks at once in the active. Examine the historical version as well.
The user can activate previous tasks at the Inactive tasks.


AI Finviz
By creating a task, the user can ask AI to find the information he or she needs. Then request a guided strategy with backtesting. Finally, ask AI everything the user wants to know.


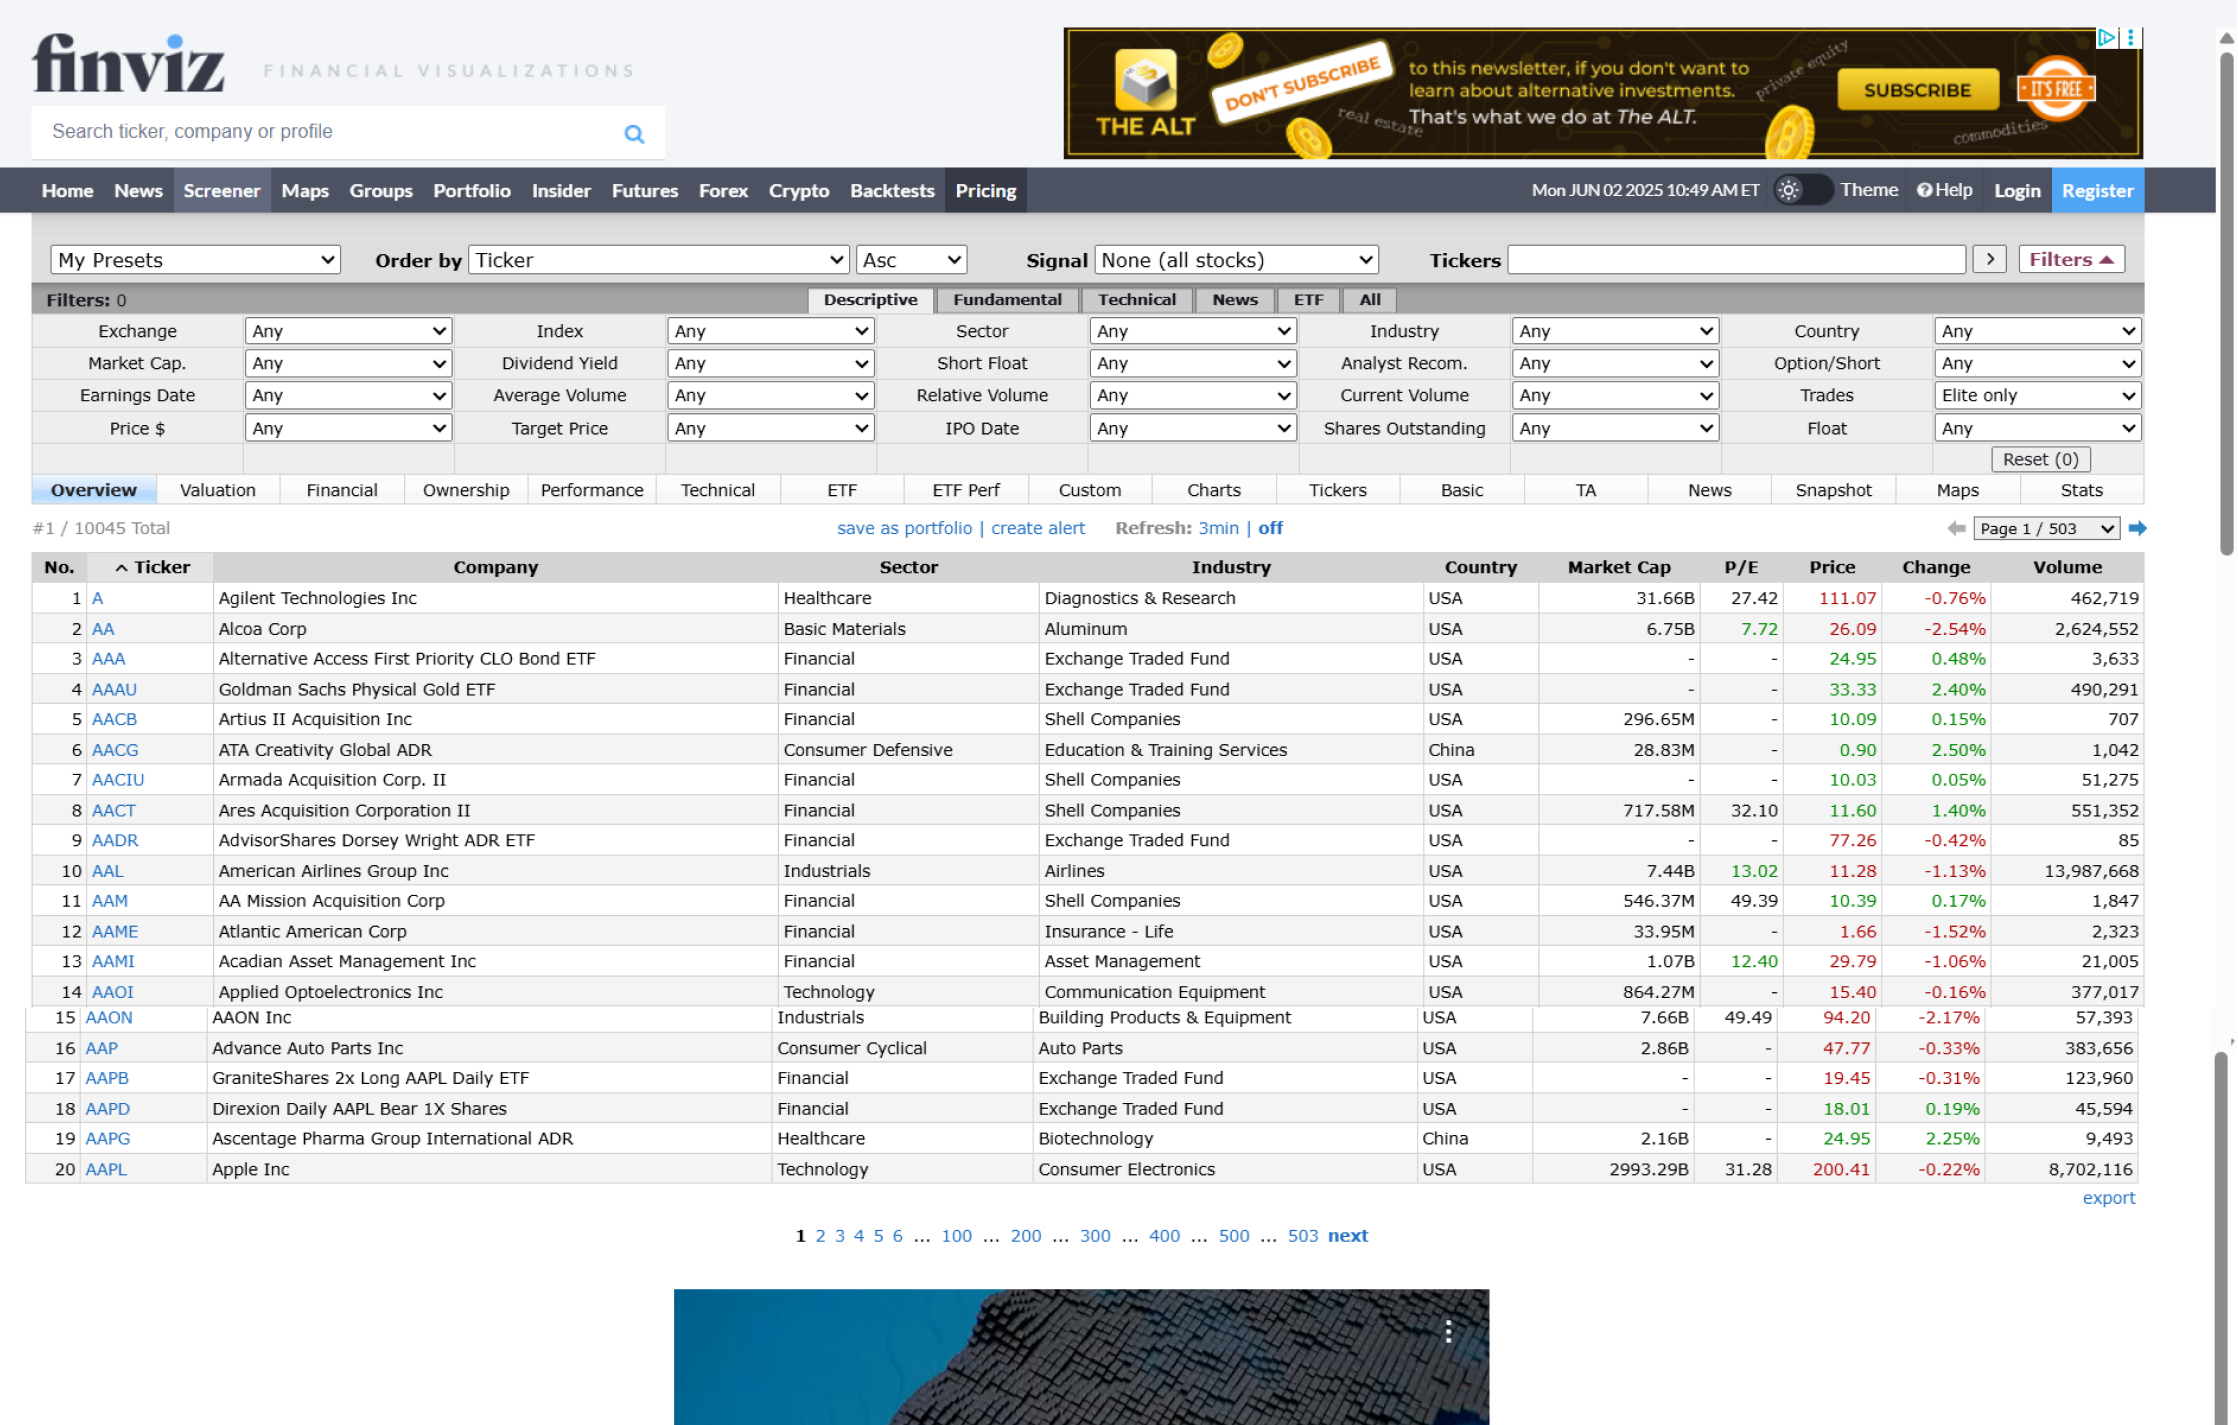 Before
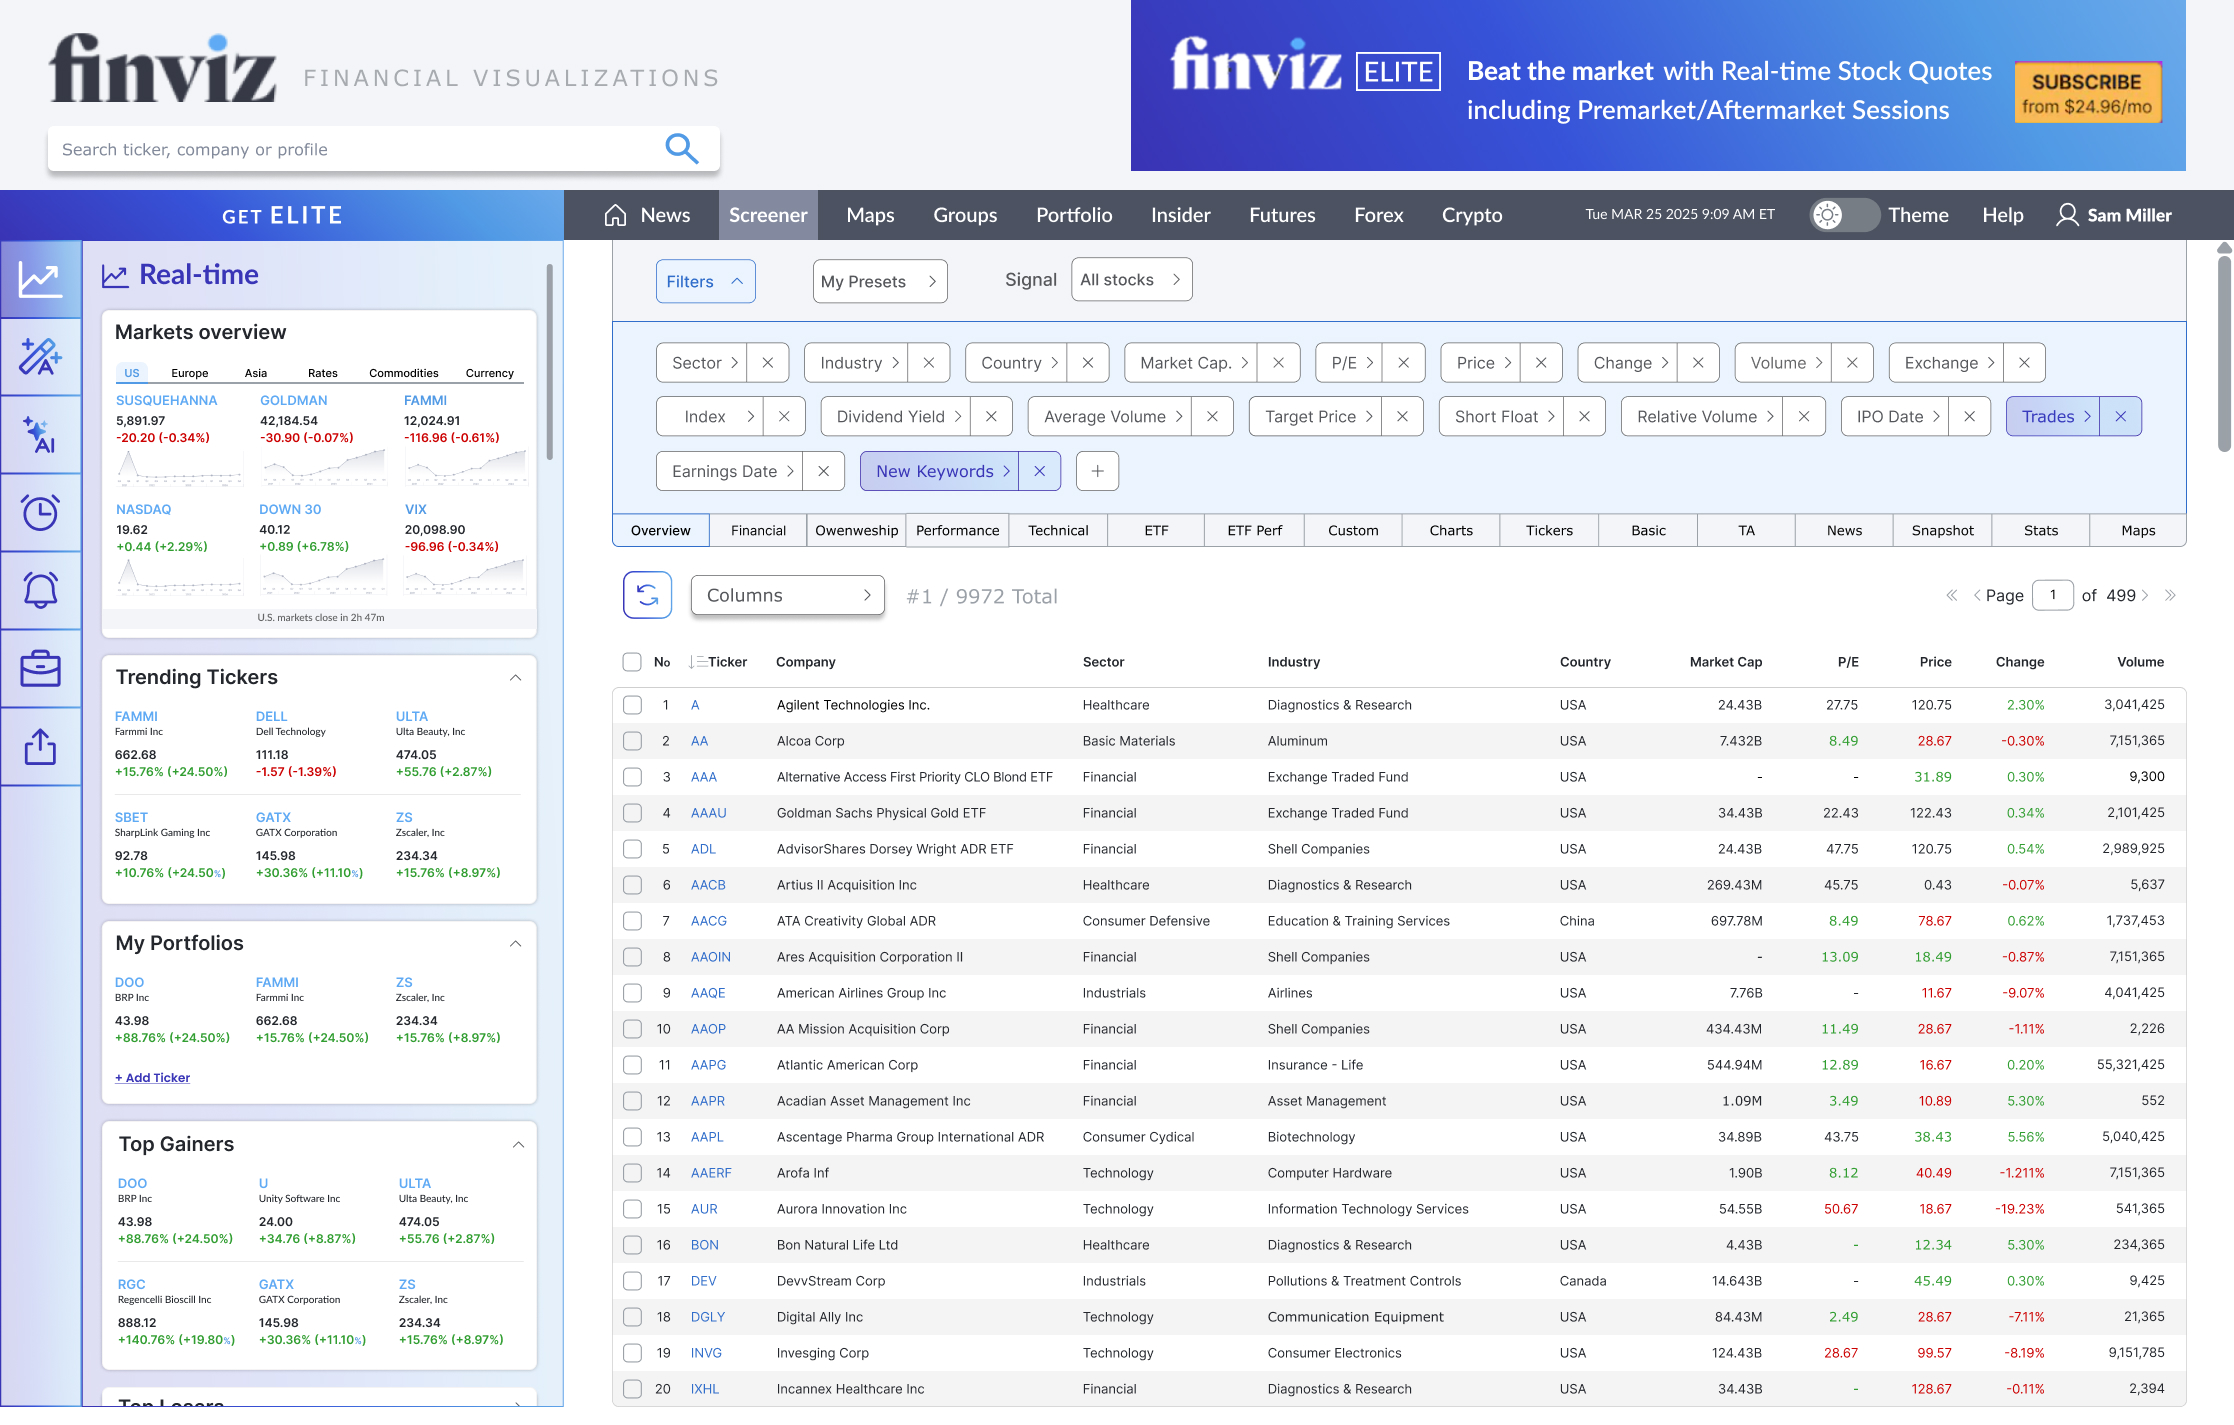 After
After